

Andover’s First GHG Emissions Inventory
“The inventory helps to identify the areas where the biggest difference can be made and set the town’s priorities accordingly.”
—Joyce Losick-Yang
Check out the slides sharing Andover’s first Greenhouse Gas Emissions inventory
Joyce Losick-Yang is leading an effort to understand the sources of Andover’s greenhouse gas emissions and how individuals, companies and the town can reduce them and save money in the process.
The first part of this work was creating a greenhouse gas (GHG) emissions inventory. A GHG inventory accounts for the emissions resulting from a defined geographic area in a given year and brings science-based data to the town’s climate action plan.
“Once there is a baseline inventory the town can track and adjust efforts to reduce greenhouse gas emissions,” said Losick-Yang, “The inventory helps to identify the areas where the biggest difference can be made and set the town’s priorities accordingly.”
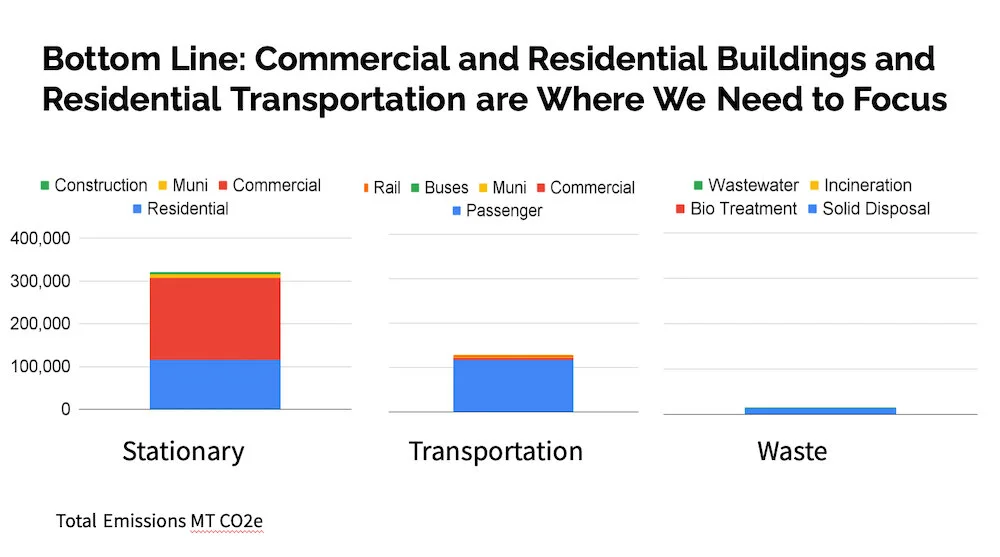
Losick-Yang worked with a small team of Andover WECAN volunteers and town support to create the first GHG inventory for Andover. The team used the Metropolitan Area Planning Council’s (MAPC) workbook to calculate the GHG inventory. 2018 was the latest year for which data were available. The inventory includes three primary buckets:
Stationary, which includes the electricity, natural gas and heating oil to keep our buildings and off-road equipment operating— think heating and cooling as two of the biggest contributors.
Transportation, which includes all passenger, commercial, MBTA bus and a portion of the commuter rail.
Waste, which includes recycling, trash and waste water.
Each of these segments had both a residential portion and a commercial portion. The commercial portion was further broken down into private and municipal. Due to the lack of available data this tool did not include emissions from industrial process and product use and agriculture, forestry and other land use.
In total, the 2018 emissions for Andover using this workbook, were calculated to be 463,000 metric tons of CO2e. Commercial buildings, residential buildings and residential transportation made up over 90% of calculated emissions.
When compared to 3 other towns that have completed the MAPC workbook (Arlington, Melrose and Natick), Andover had emissions that were higher in total and higher on a per capita basis.
In reviewing the results Losick-Yang shared, “I am not surprised by these findings. Andover has a larger industrial base than the three other towns and residents here tend to commute longer distances. In addition, we have yet to implement Andover Community Power, our community choice aggregation plan, which the other three towns have already implemented. We have made good progress in reducing emissions in some areas like through our Solarize Andover campaign and working with Mass Save. We have work ahead to incorporate additional measures that can save money and greenhouse gas emissions through efforts that increase bike and pedestrian mobility, encourage EVs, encourage residential and business electrification and more.”
Check out the full June 2021 presentation.